Categories
Analysis

Bottleneck Recession in Germany: when will the situation improve?

Introduction

It is no surprise that the COVID-19 pandemic has damaged many of the world’s biggest economies. Last year in Germany, however, economists started predicting something called a “bottleneck recession”. Many of the materials that German firms need for production of goods are in short supply, hence harming the supply chain of the economy. But when will the German economy bounce back? And what will be the consequences of such a recession?

What are supply bottlenecks?

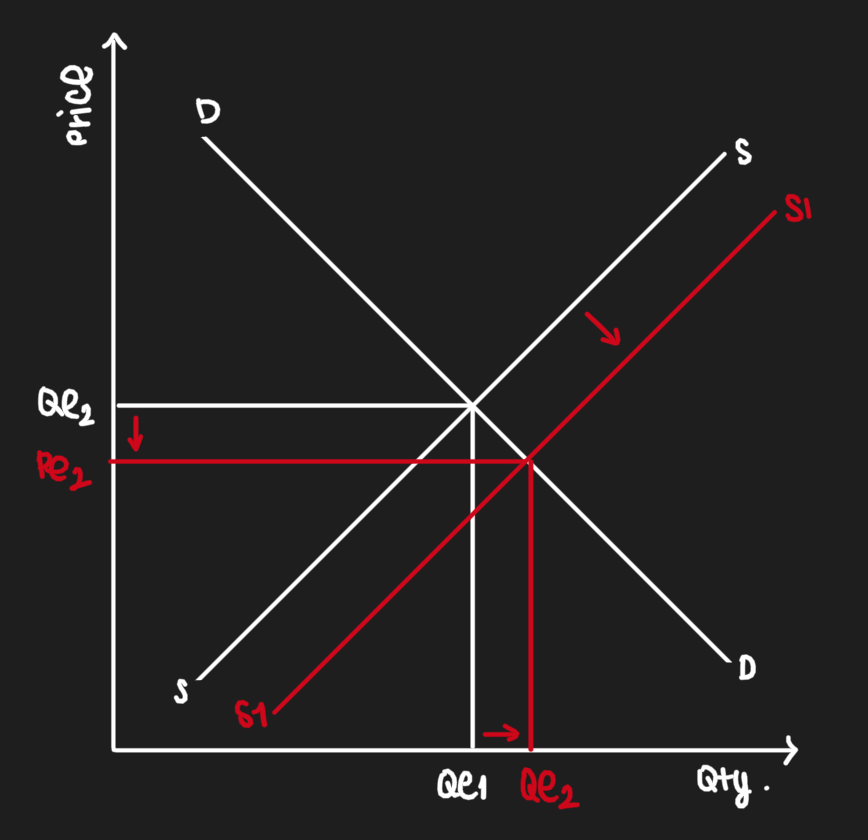
One of the most important issues to consider here are supply bottlenecks. A simple analogy for a ‘bottleneck’ would be a machine that is not working efficiently, and hence a long waiting period appears until the final result is delivered. 

In general, this occurs when price increases (inflation) result in an increase in the price of wages as well as raw materials. This causes a decrease in aggregate supply (amount of total production) of an economy. And because the demand for goods does not change (meaning people still want the same amount of goods as before), firms have to increase prices of the goods. The effect is that the increased cost of production is passed onto the consumers by firms.

Recent developments

Global supply chain bottlenecks have been one of the biggest problems in 2021 for many countries. One of the most affected economies was Germany because exports of cars, machine tools and other goods make up approximately half of its economic output. In the US, economic output depends on only 12% of  these types of exports. This sort of dependence on manufacturing and trade makes countries like Germany more susceptible to issues in the supply chain. 

Put simply, if factories do not have the necessary raw materials for production of goods, their economic output and amount of exports will decrease and hence harm the economy. 

It should be mentioned that economic output may have increased in November of 2021, but it also decreased by that same amount in December 2021, hence canceling out any growth seen in the German economy. And with the current Omicron outbreak, it is unlikely the situation will improve anytime soon. Production cuts, staff shortages and restrictions are all results of rising infection rates. Combine this with increasing costs of energy and the country’s going into the aforementioned bottleneck recession. 
However, the future isn’t all uncertain for Germany’s economy. Many think spring will “mark a resumption in the pandemic rebound”. It is expected that “energy prices [will be] digested and supply-chain problems [may be] eased by then” which would lead to growth in the second and third quarters of 2022.

Impacts

Germany already faced consequences of the supply chain bottleneck in 2021 with its car sales rapidly shrinking and “Volkswagen AG deliveries [dropping] to the lowest in a decade, despite robust orders” 

4.1% was the earlier estimate of growth in Germany in 2022, which has now been lessened to 3.6%, mainly because tensions between Russia and Ukraine may result in augmented energy prices, even more so than beforehand. 

All of this was and will be the result of the bottleneck recession in Germany. However, such bottleneck issues in many economies can lead to “corrective behavioral changes over time”. Instead of focusing on efficiency, many countries that did go through supply chain bottlenecks this past year, will hopefully focus on making their economies more resilient as well, to avoid such setbacks in the future.

Conclusion

Today, Germany’s economy is still struggling because of supply shortages, with economic growth declining and the inflation rate increasing in 2021. But there is much hope for the next few years. Germany’s economy is expected to pick back up in the spring of 2022 as infection rates will hopefully decrease and make way for the gains that will likely take place in 2023.

Sources

Deutsche Welle. “Germany’s Bundesbank Lowers 2022 Economic Growth Forecast | DW | 17.12.2021.” DW.COM, 17 Dec. 2021, http://www.dw.com/en/germanys-bundesbank-lowers-2022-economic-growth-forecast/a-60156000.

Ewing, Jack. “Fears of a ‘Bottleneck Recession’: How Shortages Are Hurting Germany.” The New York Times, 5 Oct. 2021, http://www.nytimes.com/2021/10/05/world/fears-of-a-bottleneck-recession-how-shortages-are-hurting-germany.html.

Kenton, Will. “Cost-Push Inflation.” Investopedia, 30 Sept. 2020, http://www.investopedia.com/terms/c/costpushinflation.asp#:~:text=Cost%2Dpush%20inflation%20occurs%20when. Accessed 9 Feb. 2022.

Randow, Jana. “Bloomberg – Are You a Robot?” Www.bloomberg.com, 14 Jan. 2022, http://www.bloomberg.com/news/articles/2022-01-14/german-economy-heads-for-recession-after-shrinking-last-quarter. Accessed 9 Feb. 2022.

Rees, Daniel, and Phurichai Rungcharoenkitkul. BIS Bulletin No 48 Bottlenecks: Causes and Macroeconomic Implications. 2021.

Weber, Alexander. “Omicron, Supply Shortages Risk Pushing Germany into Recession.” Www.aljazeera.com, 28 Jan. 2022, http://www.aljazeera.com/economy/2022/1/28/omicron-supply-shortages-risk-pushing-germany-into-recession. Accessed 9 Feb. 2022.

Categories
Analysis

Georgia’s Ambitions for a Regional Transit Hub

Introduction

Since the dawn of time, Georgia has remained at the crossroads of Europe and Asia. It lies in the Caucasus and is the only country in the region that has access to the sea. The government of Georgia has realized the full potential of turning Georgia into a transit powerhouse. 

Over the past few years, Georgia has been heavily investing in improving it’s connectivity with its neighbors, including Russia, by building higher capacity highways and repaving pothole-ridden roads. By 2032, it is expected that Georgia’s main economic artery, the E60, will be motorized. This corridor will allow for more traffic on the E60, or S1, the only artery that links west to east Georgia. 

A picture of the E60 currently in Zestafoni. 

Present Situation

Currently, the E60 is full of heavy duty trucks while being an open access two-lane road. The road is prone to damage and often closed due to the weather. This weakens Georgia’s main economic artery as it limits the ability to exchange capital and goods. Therefore, it also raises the costs of companies to ship across the country or to other countries. This results in many shortcomings such as limiting Georgian exports and hampering the prospects for many companies here.

In turn, this makes Georgia reliant on foreign imports, which means that Georgia consistently runs a current account deficit. To be honest, Georgia has been running a trade deficit since gaining independence. Therefore, the Georgian Lari must be strong in order to make imports cheaper, otherwise there will be imported inflation triggered by rising import prices. 

Plans of the Georgian Government

With this in mind, the Government of Georgia has decided to convert the E60 into a motorway which will allow for faster transits between Azerbaijan and Turkey, as well as improving the Georgian military road S3. 

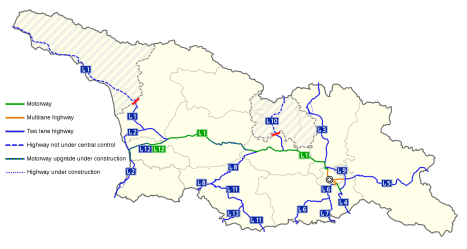
Current roadmap of Georgia 

This will reduce the cost of transportation of goods and capital, therefore, reducing the likelihood of imported inflation, along with increased competitiveness of Georgian firms as costs will be reduced. Other smaller upgrades on the S12 and S2 are underway which will further reduce the costs of transportation in Georgia which will help Georgian firms and make Georgia a transit powerhouse in the Caucasus.

Conclusion

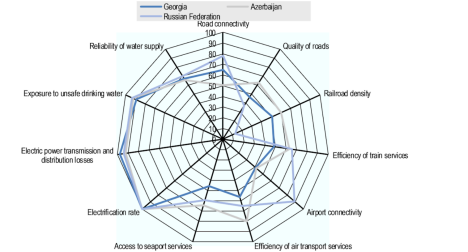
A comparison of Georgia to its neighbors. 

Regardless, there is much work to be done as shown above. This can be touted as a success in increasing the potential output of Georgia, but it is hard to say this will help increase it to its full potential as Georgia still needs a lot of work in many areas of infrastructure which the Government, in its new 10 year plan, has laid out. With further improvements in these fields, it is safe to assume Georgia will increase its potential output and keep growing at a rapid pace. 

Sources

https://tradingeconomics.com/georgia/current-account

https://agenda.ge/en/news/2021/2082

https://www.oecd-ilibrary.org/sites/c9c594ac-en/index.html?itemId=/content/component/c9c594a%20c-en

Categories
Analysis

Evaluating different measures of economic development

Introduction

Economic development is an improvement in the general standard of living in a country achieved through better education and medical services, improved infrastructure, a more equitable income distribution, and protection of the environment (sustainability). Economists have long attempted to measure the level of economic development in a country. In 1990, the human development index (HDI) was developed. Since then, further economic development indicators have been developed as well. In this article, I will look at three popular methods of measuring economic development: the human development index, the happy planet index, and the gender-related development index.

Human Development Index (HDI)

During the creation of the HDI, there was an emphasis that “people and their capabilities should be the ultimate criteria for assessing the development of a country.” The HDI assesses the health factor by the average life expectancy at birth, the standard of living factor by the gross national income (GNI) per capita, and the education factor by the “mean years of schooling for adults” and the “expected years of schooling for school-aged children starting school.” 

Some critics have argued that there are problems with the way the HDI is measured. For example, economists have criticized that the HDI “correlates factors that are more common in developed countries.” Including only one of these correlated values — such as a higher level of education leading to a higher GNI per capita — may give a better representation of a country’s well-being. Furthermore, there are possible ethical issues with the HDI not taking into account factors such as inequality, poverty, and gender equality. Lastly, some believe that the structure of the HDI implies that a person’s life expectancy has economic value, which would be unethical.

Happy Planet Index (HPI)

The Happy Planet Index (HPI) measures the level of sustainable wellbeing in a country. More precisely, it gives economists an indication of how likely it is that a nation’s population will be able to lead a long, happy, and sustainable life. The HPI is calculated by multiplying a country’s well-being by the life expectancy and dividing by the ecological footprint of a country. According to its proponents, the HPI has the advantages of offering a clear path to a sustainable and fair future by “combining life satisfaction with ecological aspects” and being relatively easy to comprehend.

However, there have also been criticisms of the HPI, most notably that the HPI completely disregards political freedom, human rights, and labour rights. Some argue that the concept of the CO2 footprint itself is controversial as it only focuses on CO2 emissions and disregards other activities like water consumption. Lastly, “happiness” and “satisfaction” are heavily subjective, culturally dependent, and perhaps difficult to influence by politics. Thus, the question of whether the HPI should be used to measure political measures — such as action against climate change — arises.

The Gender-related development index (GDI) was developed to measure “gender gaps” in human development achievements. To evaluate possible disparities between men and women, the GDI covers three dimensions of human development: health (life expectancy), knowledge (expected years of schooling and mean years of schooling), and living standards (GNI per capita). For all 167 countries, the GDI is calculated for men and women, but for all countries — based on the GDI — gender inequality still exists. 

Recently, some critics pointed out that for some countries there are no gender-specific data points available, which means that many assumptions are made while calculating the GDI. Additionally, inconsistencies with the rounding up and down in calculations have been identified. There has also been debate over the components that were chosen to calculate the GDI.

Conclusion

The above examples of ways in which economic development can be measured (HDI, HPI, and GDI) are only a small sample of the indexes used. While the human development index (HDI) may be the most well-known, there are problems with the measurement. It is very likely that as economists pursue further research in development economics, more indexes will be developed that represent the true situation in countries more accurately.

Sources

United Nations Development Programme. “Human Development Index (HDI)”. Available at http://hdr.undp.org/en/content/human-development-index-hdi (Accessed 3 December 2021).

Investopedia Team, 2021. “What are the Criticisms of the Human Development Index (HDI)?”. Available at https://www.investopedia.com/ask/answers/042815/are-there-critics-human-development-index-hdi.asp (Accessed 3 December 2021).

Wellbeing Economy Alliance, 2021. “How Happy is the Planet?” Available at https://happyplanetindex.org/wp-content/themes/hpi/public/downloads/happy-planet-index-briefing-paper.pdf (Accessed 3 December 2021).

Meinert, Sascha and Stollt, Michael, 2010. “Bruttoinlandsglück — Auf der Suche nach qualitativer Entwicklung”. 

United Nations Development Programme. “Gender Development Index (GDI)”. Available at http://hdr.undp.org/en/content/gender-development-index-gdi (Accessed 3 December 2021).


Stanton, Elizabeth, 2007. “Engendering Human Development: A Critique of the UNDP’s Gender-Related Development Index”. Available at https://scholarworks.umass.edu/cgi/viewcontent.cgi?article=1104&context=peri_workingpapers (Accessed 5 December 2021).

Categories
Analysis

The Impact of Taxes and Subsidies on the Market Price and Supply of a Product

Introduction

Taxes are a compulsory financial charge or some other type of levy imposed on a taxpayer by a governmental organization in order to fund government spending and various public expenditures. Taxes can be both indirect and direct.  A direct tax is one that the taxpayer pays directly to the government. These taxes cannot be shifted to any other person or group. An indirect tax is one that can be passed on or shifted to another person or group by the person or business that owes the tax.

Taxes

Taxes are placed on the price of a good or service, which leads the consumer to pay more for the good/service. Therefore, the imposition of a tax leads to an increase in the price of a good or service, making it look less attractive to consumers. Moreover, the introduction of taxes also impacts producers, as these taxes are also placed on the factors of production that are used to supply these goods and services. This would eventually increase the cost of production for firms, leading to a decrease in quantity supplied. As a whole, the introduction of a tax on a good/service would increase the market price and decrease the market quantity. As seen in figure 1, the increase in cost of production, led to a decrease in quantity supplied. This is shown through a leftward shift in the market diagram. With the leftward shift from SS to S1S1 we can see that the price increases from Pe1 to Pe2, whereas the quantity decreases from Qe1 to Qe2.

Subsidies

Subsidies are a form of financial aid or support extended to an economic sector, generally with the aim of promoting economic and social policy. It can also be done to ensure that a firm stays in business and to protect jobs as a whole. A subsidy is an amount of money that governments give to encourage producers and consumers to consume or produce a good or service. The amount of money is used to increase the price producers receive, while reducing the price a consumer pays for the product. Therefore, with a decrease in the price, the goods or service would look more attractive to a consumer. And with the money that producers have received they can use it to produce more goods or services. As a whole, the introduction of a subsidy would decrease the market price and increase the market quantity. As seen in figure 2, the subsidies lead to an increase in quantity supplied, which is shown through a rightward shift in the market diagram. With the rightward shift from SS to S1S1 we can see that the price decreases from Pe1 to Pe2, whereas the quantity increases from Qe1 to Qe2.

Conclusion

This concludes that taxes lead to an increase in the market price and decrease in market supply. This means that consumers have to pay more for a good or service due to the increase in the cost of production. On the contrary, subsidies lead to a decrease in the market price and increase in the market supply as the governmental organizations decrease the price that consumers pay through giving producers money to produce more of their goods and services.

Sources

  1. https://saylordotorg.github.io/text_introduction-to-economic-analysis/s06-01-effects-of-taxes.html
  2. https://www.investopedia.com/terms/i/indirecttax.asp
  3. https://www.investopedia.com/ask/answers/060215/how-do-government-subsidies-help-industry.asp
Categories
Analysis

Is it possible to over-regulate the banking system?

Introduction

Since the days first banks were opened, debates over how the banking system should be regulated have persisted. After the mortgage crisis of 2008, the debates reached a peaking point because the crisis was mostly caused by the actions of the banks. In my opinion, it is definitely possible to over regulate the banks.

Why banks should not be regulated

A major reason why banks should not be regulated too strictly is that it would violate free market principles. Banks are an essential component of a market economy, and by controlling their work, there is a danger that the government will gain too much control of the market. In other words, because governments could set the loan rates — that have a huge influence on the cost of production — governments would be able to regulate the prices of most domestically produced goods. Of course the Central Bank already has a large influence on banks because it controls the loan rates, which are given to the banks. Thus, the Central Bank indirectly influences the deposit and credit rates. However, central banks do not use this instrument frequently, in fact mostly only during times of soaring inflation.

Moreover, if the government has too much control over the banking system, people lose the desire to invest in the country. The high concentration of power in the hands of the government, and thus the likely lack of a free market, disincentivize potential investors. In other words, people are scared that governments can make decisions that are beneficial only to the government itself. Of course the more power the government has, the easier this is for the government to overrule the banking system. When the government controls the economic life of a country, it starts to become authoritarian. This was explained by professors James Robinson and Daron Acemoglu in their book “Why Nations Fail?”. Robinson and Acemoglu state that countries fail if the government has too much control over the economy. People are unlikely to invest money if they are unsure of whether the money will be returned to them. The book also explains that having strict governmental control of the economy can have a positive effect in the near future but is destructive in the long-term.

Conclusion

However, not regulating the banking system at all is a false narrative in my opinion. Banks are keen to maximize their revenues and, thus, can make decisions that are not beneficial to a country’s economy. For example, banks may decide to give out loans to people who they know cannot afford them. This means that the purchasing ability of the entire population decreases. To minimize their risks, banks can transform the credits and mortgages into obligations and sell them. This way, they do not carry the risks themselves but even increase their revenues instead. Such actions caused the mortgage crisis of 2008, which had absolutely horrible consequences to the world economy. To conclude, I think that the banking system should not be over-regulated.

Categories
Analysis

The Economics of “Black Friday”

Introduction

Black Friday is always on the Friday after American Thanksgiving and fell on the 26th of November this year. Originally, Black Friday was an American tradition that started with New York’s apartment store “Macy’s” in the early 1900s. More recently, however, Black Friday has spread across the world and is very popular due to its characteristic low prices. This leads one to question how it is possible for Black Friday to still be so profitable for retailers.

Loss Leader Marketing

Loss Leader Marketing is a marketing tool that businesses use to gain brand loyalty and to attract new customers, especially on Black Friday. The strategy behind loss leader marketing is that customers are incentivized to enter a store through the promotion of a special discounted item. This discounted item is placed toward the back of the store so that customers walk past many other products (these often aren’t discounted) in order to reach the product. Customers often end up buying more than just the discounted item, which means that the total sales of all the products make up for the loss the store incurs through the discounted item. Consumable items — items with higher margins that are repeatedly purchased — are often marketed using this loss leader marketing strategy. 

For example, the retail giant Costco has established a reputation as being a low-price distributor among consumers. Costco achieved this reputation by selling some discounts on items such as gasoline, food, and in-store items. This brand image means that consumers often first think of Costco when considering whether or not to make a purchase, which increases the total sales Costco makes.

Price Discrimination Strategies

Price discrimination is another marketing strategy that aims to make use of the various amounts consumers are willing and able to pay. In a retailer’s perfect world, every consumer would pay the maximum amount they are willing to pay for the product, meaning that producer surplus is maximised. This marketing strategy is also used on Black Friday by retailers to break into new markets and draw in new consumers. Companies may price discriminate by setting their products at different prices in different stores, depending on the income of people who are most likely to pass that store.

2021’s Black Friday

Early observations have revealed that there were most likely fewer people out physically shopping on Black Friday in 2021 than in previous years. Instead, more and more people seem to opt to shop online instead. The National Retail Federation predicted an increase in sales between 8.5% and 10.5% from 2020 while early data from Mastercard Spending Pulse revealed that Black Friday sales may have actually been up by 12.1% in the US.

Conclusion

Due to COVID-19, fewer and fewer consumers are shopping in physical stores and many have switched to online retailers instead. This is bad news for smaller firms who cannot compete with “super-retailers” like Amazon. As there is a shift towards online retail, shopping bots have also become more and more popular among consumers to ensure that they will be able to get a pair of those rare sneakers. Finally, there has also been a trend in recent years to not limit Black Friday Deals just to Black Friday. Increasingly, more and more retailers are offering Black Friday discounts much earlier, some as early as October.

Sources


Discussion Question: What is your experience with Black Friday discounts?

Categories
Analysis

Singapore’s sustainable packaging industry

Introduction

Packaging can be made from any material and is used to contain, protect, handle, deliver, or present goods. A large proportion of Singapore’s domestic waste is packaging waste. In 2018 about one-third of disposed domestic waste consisted of packaging. Approximately 55% of the packaging waste was plastic packaging, whilst 25% was paper packaging. The remaining 20% was made up of other types of packaging materials, such as metal and glass. As packaging is so common yet hardly reused, we need to find ways to reduce and consume it more sustainably.

Sustainable packaging includes recyclable mono-polyolefin packaging, recyclable paper packaging, and degradable/compostable plastic packaging. Sustainable food packaging can help secure the safety of the food consumed and reduce the amount of food wasted. This in turn benefits Singapore’s food security, and, at the same time, provides solutions to solve plastic pollution.

The Singapore Packaging Agreeement

The Singapore Packaging Agreement (SPA) is a joint initiative started in 2007 by the government, industry, and non-governmental organizations (NGOs) to reduce packaging waste. Since its inception more than 200 organizations in Singapore have worked together to cut down on packaging waste. As of 2019, they have cumulatively reduced about 54,000 tonnes of packaging waste, resulting in estimated packaging material cost savings of $130 million for locally consumed products.

Supporting ground-up movements

One such initiative was Zero Waste SG’s Bring Your Own (BYO) campaign, supported by the Call for Ideas Fund. This initiative aimed to encourage consumers to use reusable bags and containers when they buy takeaway food, beverages, and groceries. Since 2017, more than 400 retail outlets have joined the campaign, providing incentives for customers to bring their own reusables. This has saved approximately two million pieces of plastic disposables and packaging. Leveraging the success of BYO, the NEA supported Zero Waste SG with the Partnership Fund to further develop the campaign in 2019 into Bring Your Own Bag (BYOB) to focus on reducing disposable plastic bag usage.

The packaging waste management roadmap

Packaging is not all bad. It extends the shelf life of food and protects new products from damage during transportation. However, the problem is excessive packaging. Mandatory reporting of packaging data and 3R plans for packaging were introduced in 2020 and legislated under the Resource Sustainability Act. This builds on an existing mandatory waste reporting framework for large malls and hotels, which will also be expanded to all large industrial and commercial premises, including large convention and exhibition centers. The mandatory packaging reporting framework means that producers of packaged products and supermarkets with an annual turnover of more than $10 million will be required to report data on the packaging that they put on the market and their 3R plans for packaging.

The mandatory packaging reporting framework will also lay the foundation for an EPR framework for managing packaging waste, including plastics. This ensures producers are responsible for the collection and recycling of the materials they use to package their products. The aim is to have the EPR system for packaging waste management in place no later than 2025.

Closing the plastics loop

The use of plastics is prevalent in our daily lives – many of our beverage bottles, takeaway food containers, and grocery bags are made of plastics. While plastics can be useful, they are often used in excess and discarded in large amounts.

Plastic has become an issue of significant concern globally as countries re-examine how to sustainably manage their plastic waste. In Singapore, we incinerate all our general waste, minimizing the amount of plastic that ends up as litter both on land and in the oceans. At the same time, because of the drive towards a circular economy to replace the “take-make-dispose” linear economy, and the push to reduce industrial carbon emissions, there has been an increasing interest in the industry to explore more advanced technology to close the plastics loop.

Take, for example, the adoption of chemical recycling to turn plastic into feedstock or fuel. Apart from the current prevalent technology of using mechanical recycling to recycle plastics, chemical recycling technology involves converting separated or mixed plastics back into pyrolysis oil, naphtha, methanol, and syngas. These products can either be converted back into building blocks that can be used to make new plastic products or converted into fuel to replace fossil fuel sources. In particular, there are opportunities for mixed or dirty plastics to be recycled. This is crucial as these mixed and dirty plastics cannot currently be recycled. As a petrochemical hub, Singapore is well-placed to harness this new growth area to close the plastics loop.

Imposing a charge for single-use plastic bags may divert demand to paper or bio-degradable bags, which may not be more resource-efficient from a lifecycle perspective. This is because the production and disposal of all materials have some degree of environmental impact. Therefore, we will have to work on managing excessive consumption of all types of packaging and disposables.

Sources

  1. https://www.businesstimes.com.sg/government-economy/initiative-to-build-industry-capability-in-sustainable-management-of-packaging
  2. https://www.euromonitor.com/packaging-industry-in-singapore/report
  3. http://www.packaging-partnership.org.sg/past-event/sustainable-packaging-our-shared-future
Categories
Analysis

The importance of a “prototype” in the business world

Introduction

There are numerous directions a person can take in order to succeed. In many cases, an important factor that determines someone’s success is the techniques and skills a person has, such as dribble skills for soccer players and teaching skills for professors. However, in the business field, especially when you make new businesses/products, and promote them, one of the most important indicators of a success is a good prototype. By definition, a prototype is “the first example of something, such as a machine or other industrial product, from which all later forms are developed”. The word prototype is usually used for computer programming, cars, or trains to make sure that the products are safe enough to operate in the real world. To some it may seem as if prototypes are not related to the business field, but it is a vital component of a successful business.

When you start a new business, what you want to do is promote your startup by showing your brand’s strengths. While doing this, there are thousands of factors people should consider, starting from the business concept to more in-depth details. By developing some prototypes, a business is able to convince potential investors and customers of all the benefits their startup brings. A good prototype is like an insurance for business owners that mitigates the risk of their business failing. This is why making prototypes is crucial. At the same time, because the prototype is usually developed before a company starts to sell products, it should be done rapidly with minimum costs to prevent a large loss.

Methods of developing prototypes

Mainly, there are two ways to make prototypes: digital and physical

  1. Digital Prototyping

Digital prototypes are usually used when developers would like to check apps or homepages that people use on their device.

A digital prototype can be made by using existing resources, such as Figma or Wix. By utilizing those, developers can check how the apps work on consumers’ devices step by step. That way, they can improve their business from the users’ perspectives. Because those resources are specialized for prototypes, it is less time-consuming, and they have many features that other prototypes do not have, such as a size controller for each type of smartphone and templates for apps and homepages. The disadvantage is that they have to pay extra fees to acquire better features. Also, it is sometimes too complicated to manage all the steps if there are many pages or buttons.

(Below is an example of a digital prototype on Figma)

The other way a digital prototype can be made is by using physical materials to test the online service. This is a more analog way to make prototypes for apps or homepages, but by utilising physical elements, people are able to edit them easily by erasing things, or adding graphs with a pencil, etc. It sounds like a simple way, but obviously, it is less expensive than using paid services. Usually, such a physical prototype is enough for the entrepreneurs to get an understanding of how consumers will experience their product once it is launched.

(Below is an example of a digital prototype made by paper)

2. Physical Prototyping

The other type of prototypes is called physical prototyping. Physical prototyping is used when people are trying to make a new physical product and not a digital product. A physical prototype can be “anything from a single handmade model to a fully operational model, representing how the conceptual design will correspond to real-world conditions”. For instance, the backpack shown below looks easy to be broken and made with papers and tapes. However, by making it and carrying it, the developers can realise detailed problems that they might not be able to notice without such a prototype, such as the position of pockets of the backpack, or simply the appearance of the product.

On the other hand, the prototype of a vacuum looks like a real one and is detail-oriented, but it is still a type of physical prototyping. Thanks to the invention of 3D printers, it has become easier for people to make more realistic physical prototypes with less time-consuming, and less money. Even if the entrepreneurs don’t have enough money to buy such an expensive 3D machine, people can still make physical prototypes by utilising things that are around them, such as stationery, furniture, or food.

Conclusion

Even though factors such as personal connections, good business strategies, and financing are important for the success of a new business, it is essential for new business to have a good prototype to make sure that their new product or service works well. Thanks to the development of new digital techniques, and resources becoming more readily available, it has become much easier for entrepreneurs to make prototypes than before. In summary, if you are looking into starting a new business in the future, I strongly urge you to not forget to make a prototype before you actually launch your business.

Sources

https://www.steveglaveski.com/blog/12-types-of-prototypes-to-test-your-idea

https://www.interaction-design.org/literature/article/prototyping-learn-eight-common-methods-and-best-practices https://waykenrm.com/blogs/physical-prototype/

Categories
Analysis

Female Marginalisation in the Informal Economy of Punjab

Introduction

Female marginalisation is a part of gender marginalisation. It is the presence of strong gender discrimation, persecution and subjection in all societies. The focus of this article is the informal economy of Punjab, which is the part of the economy that is not covered by any rules and regulations. The informal economy is also not monitored by the government, causing the rights of the informal workers to be taken away. Punjab is a state in northern India with a population of 30,451,858 people and its economy is around 80-90% informal. The cause of the female marginalisation in Punjab is the gender disparity, gender inequality, confining of females, and violence against women. Gender disparity is known to be a cause because there is a large difference in the population of men and women in Punjab.  As the age increases, the number of females decreases. This demonstrates that women do not receive proper health care and are even killed sometimes because they are labelled as being a liability. Gender inequality is shown through the difference between the wages the two gender groups earn and ill-treatment. Women often go through violence at workplaces, whether it be sexual or physical.

Why does Gender Inequality Exist?

Gender inequality exists because men are known to be more competent. For instance, family business are usually overtaken by sons instead of daughters as society believes that women are rather incompetent to run a business, which causes men to be in a superior position compared to women. The female marginalisation includes the inequality of the rights, the physical and sexual abuse and the gender disparity. There are 2 rape cases reported in Punjab every day, and most rape cases are not even reported. The female marginalisation in Punjab  has been there for years and it continues to be present. It was recently aggregated through the pressure of globalisation as there was an increase in the number of jobs available, however women were labelled too incompetent to take part in any of those jobs. The reason why female marginalisation is still present is because of the sexist mindset that has been adopted, the lack of education to combat sexism, and the lack of opportunities for women.

Superiority Bias & Stereotypes

This study shows us that women are socially identified through social and cultural norms. Through the perspective of the Punjabi Women, they are categorized by their gender (that they are females), their level of education, and level of income (which is extremely low). There are two groups that are known to be more superior than them, which are: men in the informal economy and people in the formal economy. The difference between men and women in the informal economy is only the gender but men in Punjab are perceived to be superior in general. Therefore, even if a woman is well-educated, it is overlooked as they are believed to be inferior to men. People in the formal economy differ as they have a higher level of education and a higher level of income. The conflict in Punjab is caused due to the stereotyping of Punjabi women. The stereotypical mindset of women being less educated, less succesful, and incompetent does not let them recieve basic rights, formal jobs, or even higher wages. The effect of the stereotyping is that this conflict will never come to an end, due to the fact that it is normalised. When the stereotype of a women in the informal economy of Punjab is known to be incompetent, many rights are snatched away from her immediately. Therefore, a conceited stereotype is one of the causes of the conflict and as long as this stereotype of women remains in people’s mind, the problem of female marginalisation will too.

Social Schemas

People perceive Punjabi women inferior to men because it fits their schema. Schemas are a cognitive framework or concept that help organize and interpret information. The idea of women being less educated, lower in the hierarchy, and incompetent is what fits in to the schema of Pubjab’s society. It’s the mindset that has developed over the course of many years. The question is where this schema comes from. Firstly the cultural norms. A lot of importance and value is devoted to the birth of a male child and a female child is often just viewed as an extra child to feed. This mindset is what makes women incompetent and due to the incomeptence, they are not educated. Punjabi Pop (Punjabi Music) is another reason these schemas have been aggravated. A lot of the lyrics of Punjabi music enforce the notion of masculinity and therefore, are revived in an aggressive manner that keeps women vulnerable. Lastly, the patriarchal society of Punjab perceives men to be the head of the house keeping women at a lower position.

Conclusion

All in all, the ideology of a women being inferior in comparison to a man, or stereotyping females to be incompetent, results in the marginlisation of women and does not let them rise up to the formal economy. It all roots from the schemas that individuals conceive about females, and the only solution to this issue is education. It is vital that these stereotypes are broken down, with the help of education in schools around Punjab.

Bibliography

  1. Azhar, Ume. “Women and Informal Economy: Home-Based Workers Most Neglected in Dealing with Coronavirus Pandemic | Political Economy | Thenews.com.pk.” Www.thenews.com.pk, 17 May 2020, http://www.thenews.com.pk/tns/detail/659184-women-and-the-informal-economy. Accessed 13 Dec. 2020.
  2. Feminism, Satvinderpal Kaur, et al. “MR Online | Navigating Educational Empowerment through Life Conditions: A Study of Rural Women in Indian Punjab.” MR Online, 9 Oct. 2019, mronline.org/2019/10/08/navigating-educational-empowerment-through-life-conditions-a-study-of-rural-women-in-indian-punjab/. Accessed 13 Dec. 2020.
  3. “Formal and Informal Economies – Regional Economic Development – Eduqas – GCSE Geography Revision – Eduqas.” BBC Bitesize, http://www.bbc.co.uk/bitesize/guides/z3spj6f/revision/1. Accessed 13 Dec. 2020.
  4. Gill, Anita. “Agricultural Credit in Punjab: Have Policy Initiatives Made a Dent in Informal Credit Markets?” ResearchGate, Feb. 2016, http://www.researchgate.net/publication/314696755_Agricultural_Credit_in_Punjab_Have_Policy_Initiatives_Made_a_Dent_in_Informal_Credit_Markets.
  5. Government of Punjab. Economic and Statistical Organisation. 2020.
  6. Guha, Sriparna. “Women and Development in India: An Issue of Marginalization of Female Labour.” Catalog.ihsn.org, 2012, catalog.ihsn.org//citations/9675. Accessed 13 Dec. 2020.
  7. “Informal Economy in the Philippines (ILO in the Philippines).” Ilo.org, 2020, http://www.ilo.org/manila/areasofwork/informal-economy/lang–en/index.htm.
  8. “Introduction.” Cambridge University Press, Cambridge University Press, 2017, http://www.cambridge.org/core/books/global-health-crisis/introduction/FD357851113C3299CDF1D307B1F408B1/core-reader. Accessed 2 Apr. 2021.
  9. Jodhka, Surinder. “In the Name of Development: Mapping Taith-Based Organisations’ in Maharashtra.” ResearchGate, Jan. 2012, http://www.researchgate.net/publication/289785120_In_the_name_of_development_Mapping_taith-based_organisations%27_in_Maharashtra. Accessed Jan. 2012.
  10. Joy. “What Is Power Distance?” Organizational Psychology Degrees, http://www.organizationalpsychologydegrees.com/faq/what-is-power-distance/#:~:text=Power%20distance%20refers%20to%20the. Accessed 13 Dec. 2020.
  11. jules. “Microfinance & Women Empowerment :A Case Study of Punjab.” SlideServe, 3 Oct. 2014, http://www.slideserve.com/jules/microfinance-women-empowerment-a-case-study-of-punjab. Accessed 13 Dec. 2020.
  12. Kaur, Manjinder. “Gender Marginalization and Gender Discrimination in Punjab, India: The Study of Son Preference and Lower Status of Girl Child in Two Villages.” Isaconf.confex.com, Isaconf, 18 July 2018, isaconf.confex.com/isaconf/wc2018/webprogram/Paper92334.html#:~:text=Gender%20marginalization%20is%20by%20now. Accessed 13 Dec. 2020.
  13. Manav, Harish. “Punjab Sees 21% Rise in Crime against Women amid Lockdown.” Https://Www.outlookindia.com/, 23 Apr. 2020, http://www.outlookindia.com/website/story/india-news-punjab-sees-21-rise-in-crime-against-women-amid-lockdown/351333.
  14. Mirza, Wasim. “Walls of Poverty & Marginalisation Weaken Women’s Voice in Pandemic Governed Economy – the New Leam.” Https://Www.thenewleam.com/, 4 Sept. 2020, http://www.thenewleam.com/2020/09/walls-of-poverty-marginalisation-weaken-womens-voice-in-pandemic-governed-economy/. Accessed 13 Dec. 2020.
  15. “Population of Punjab 2020- Current Population of Punjab India.” Www.indiaonlinepages.com, http://www.indiaonlinepages.com/population/punjab-population.html. Accessed 13 Dec. 2020.
  16. “Punjab Population Sex Ratio in Punjab Literacy Rate Data 2011-2020.” Www.census2011.Co.in, 2020, http://www.census2011.co.in/census/state/punjab.html. Accessed 13 Dec. 2020.
  17. Pushkarna, Mridula. Gender Disparities in Punjab. Jan. 2016.
  18. Service, Tribune News. “Masculinity Continues to Be the Norm in Punjab.” Tribuneindia News Service, 20 Feb. 2016, http://www.tribuneindia.com/news/archive/comment/masculinity-continues-to-be-the-norm-in-punjab-198550. Accessed 13 Dec. 2020.
  19. Wikipedia Contributors. “Informal Economy.” Wikipedia, Wikimedia Foundation, 8 July 2019, en.wikipedia.org/wiki/Informal_economy.
Categories
Analysis

Meet the Doughnut!

Introduction

“The Doughnut” offers a vision of what it means for humanity to thrive in the 21st century – and Doughnut Economics explores the mindset and ways of thinking needed to get us there. First published in 2012 in an Oxfam Report by Kate Raeworth, the concept of “Doughnut Economics” rapidly gained traction internationally. Examples are the UN General Assembly and the Occupy movement. Released in 2017, “Doughnut Economics: seven ways to think like a 21st-century Economist” by Kate Raeworth further explored the economic thinking needed to bring humanity into the Doughnut, drawing together insights from diverse economic perspectives in a way that everyone can understand. The book soon became an international bestseller and has now been translated into over 20 languages.

What is “Doughnut Economics?”

They say a picture speaks a thousand words, so let us see the state of humanity just in a single image – the Doughnut of social and planetary boundaries is just the compass we need for creating a safe 21st century.

The outside of the doughnut economic model represents the unsustainable impact on the environment while the hole in the centre reveals the proportion of people worldwide falling short on essentials, such as food, water, healthcare and political freedom of expression. Thus, the challenge here on the part of humanity is to get everyone out of that hole. At the same time, we cannot afford to be overshooting the outer crust of the doughnut, so that we safeguard the life-giving systems of the Earth – such as a stable climate, healthy oceans and a protective ozone layer, on which all our well being fundamentally depends.

The 21st Century Mindset

The starting point of Doughnut Economics is to change the aim of endless GDP (Gross Domestic Product) growth to thriving in the model of the Doughnut.

 At the same time, begin the economic analysis by seeing the big picture and recognising that the economy is embedded within. An embedded economy emphasises the interdependence of economic activities and the social world. Doughnut Economics highlights the fact that all economies are fundamentally dependent upon society and the living world. Moreover, this theory recognises that human behaviour has the potential to be nurtured – to be cooperative and caring, just as it can be competitive and individualistic. Therefore, a shift from capitalist thinking to a more collaborative approach is desirable. It also recognises that economies, societies, and the rest of the living world, are complex, interdependent systems that are best understood through the lens of systems thinking. Lastly, Doughnut Economics recognises that growth is a healthy phase of life, keeping in mind of course that nothing grows forever.

The Case of Amsterdam Embracing this Economic Theory

In April 2020, during the first wave of COVID-19, the city government of Amsterdam announced that it would recover from the crisis and avoid future ones by embracing the theory of “doughnut economics”. Amsterdam has the vision to become a thriving, regenerative and inclusive city for all its citizens while respecting the planetary boundaries, which makes the city a pioneer of such systemic transformation. In this spirit, the City of Amsterdam has joined the Thriving Cities Initiative (TCI), a collaboration between C40, Circle Economy, and Doughnut Economics Action Lab, which works with cities pursuing such a transformation.

The key tool of the TCI is a City Portrait based on the Doughnut of social and planetary boundaries. It is a holistic snapshot of the city and serves as a starting point for big-picture thinking, co-creative innovation, and systemic transformation, rather than as a comprehensive assessment of the city. In the past, the city has been recognised for its ‘Amsterdam Approach’ to collaborative innovation, which connects neighbourhood initiatives, start-ups and civil society with the established institutions of government, business and knowledge institutions. Furthermore, the city is home to a dynamic network of changemakers that have already begun using Doughnut-inspired thinking to drive systemic change. With such an opportunity, Amsterdam can be a pioneer of what it means to become a thriving city and in doing so inspire cities worldwide on their journeys of transformation.

How will Amsterdam implement this theory?

Amsterdam is using this framework to explore what it would mean for Amsterdam to:

  1. Thrive within its natural habitat
  2. Respect the wellbeing of people worldwide
  3. Respect the health of the entire planet

Having the ambition to bring all of its 872,000 residents inside the doughnut, Amsterdam wants to ensure everyone has access to a good quality of life while at the same time not putting pressure on our planet. Guided by Raeworth’s organization, the Doughnut Economics Action Lab (DEAL), the city is introducing massive infrastructure projects, employment schemes and new policies for government contracts to that end. Meanwhile, some 400 local people and organizations have set up a network called the Amsterdam Doughnut Coalition to run their programs at a foundational level.

What Would it Mean for Amsterdam to Thrive?

What defines whether the population of a city is thriving or not? The best answer surely comes from the people themselves – based on their local context, aspirations, culture, and values. The many components of wellbeing are clustered into the following four areas: 

What defines whether the population of a city is thriving or not? The best answer surely comes from the people themselves – based on their local context, aspirations, culture, and values. The many components of wellbeing are clustered into the following four areas: 

  • healthy: food, water, health, housing
  • enabled: education, energy, income and employment
  • connected: mobility, community, digital connectivity, and culture 
  • empowered: social equity, political voice, equality in diversity, and peace and justice

Looking into the thoughts of the residents of Amsterdam and their visions and priorities for a thriving Amsterdam, several valuable insights emerged.

When asked “what makes you thrive?” the most popular response from participants focused on connecting with nature. One of Amsterdam’s residents stated: “I hope that the City can create more green spaces while the city is growing so rapidly. It helps biodiversity and gives the possibility of meeting other Amsterdammers.”

In terms of thriving in its natural habitat, urban designers in Amsterdam are integrating biomimetic designs into the fabric of their buildings. Some are creating habitats for species directly in the fabric of buildings, such as by using bee-hotel bricks, and ensuring retaining walls include places for nesting birds. Incorporating green roofs and walls that help to connect fragmented habitats supports more native species, and creates pollinator corridors. The City of Amsterdam is likewise taking action to significantly reduce air pollution with its Clean Air Action Plan, expanding the current low-emission zones, culminating in a complete ban on petrol and diesel cars and motorbikes in the city by 2030. The Clean Air Action Plan would encourage the city to set goals that match the ability of a nearby thriving forest to capture particles and create clean air. Pursuing such aspirational and scientific aims could restore the sense of purpose of the community and ensure the wellbeing of all.

Sources

https://doughnuteconomics.org/about-doughnut-economics

https://time.com/5930093/amsterdam-doughnut-economics/

Roworth, Kate. “The Amsterdam City Doughnut,” March 2020: Amsterdam.